Sep 23, 2025
Forward Portfolio Introduction
Elevate Your Investment Strategy with Advanced Stock Selection

Take control of investments with confidence. Build a portfolio aligned with risk tolerance and financial goals. Simplify allocation, invest smarter, and achieve growth. Stay on track to financial success, whether experienced or new.
.webp)

Stock screening


The Sharpe Ratio is named after William Sharpe, Nobel winner in 1990 along with Harry Markowitz, who developed the mean-variance portfolio approach. They were among the fathers of what we call Modern Portfolio Theory. The Sharpe ratio is the expected return over the expected risk, and the higher the better. It is a very useful tool for stock selection. A Sharpe Ratio of 1.0 suggests that the expected return of say 10% has a volatility of 10%. Many stocks will have Sharp Ratios below 1.0 and some well above, but we need to be careful about any estimates above 2 or 3 as these may be unrealistic. Still, you can select filters that include such stocks or those with even higher ratios. This is a very useful stock selection filter.
Sharpe Ratios do not consider diversification or how stocks fit together, that is where Markowitz comes in. Sharpe Ratios are higher for individual stocks than they are for aggregate portfolios as a result of some stocks moving counter to one another. Stocks with low or negative correlations can provide much more stable portfolios. Note that we do not use historical correlations for most stocks but rather forecast correlations since we know that the correlations vary over economic cycles. We do use historical assumptions for the micro stocks that have limited or no options markets. Using only historical correlations will result in a fairly random portfolio results and while diversification helps, we think we can do better with forward looking models. Be very careful about picking any stock or portfolio where implied volatilities are over 35%. These are very risky.
Now, let’s say you picked out several stocks with very high Sharpe Ratios, and the expected results look great. One problem may be that you picked out only micro stocks with little liquidity or thin trading. By definition, small-cap stocks are those with total aggregate market valuations or market capitalization under $2 billion. From $2B to $10B, we call these mid-sized market cap stocks, and $10B plus are large-cap stocks. Many investors will not invest in any company with a market cap under $1B because they are concerned about the ability to buy or sell without affecting the stock price. Buying several million of Microsoft will not affect the price, but for a market cap stock at $50 million (of which there are many) and an average trading volume of a few hundred thousand dollars, buying or selling a large order could affect the price.
If you are a small-scale investor, market cap may not be a big concern, but also keep in mind that small companies may have more insider ownership, so be sure to research that. You generally don’t want to buy stock in a company worth $30 million where one investor holds $20 million of the total share value. If you stick with larger firms, this is generally not an issue.
Investors seeking more current income from their portfolio always have the option to sell off shares. This strategy may also reduce tax consequences, as the max capital gains rate is well below the max rate on dividend income. However, for investors who want steady income, setting a minimum filter on dividend rates is a good criterion to consider.
Stocks with higher dividend rates, like utility companies and REITs, generally do not have high expected growth rates in terms of their stock prices. Stocks with low or no dividend payouts may be higher-income growth stocks.
Also, be aware that very high dividend rates, such as 10% or above, are generally not sustainable. They may reflect the expectation that dividends will be cut or signal other problems with the company's earnings, so be cautious when chasing very high dividends. Still, they may fit well into a 401(k) plan, an IRA account, or a child’s education fund where current earnings are not taxed.
The average PE ratio in the stock market is typically about 15 to 20. A PE ratio of 20 suggests investors are willing to pay twenty times the current earnings of the firm. Average PE ratios tend to move inversely with general interest rates — when treasury rates are relatively low, we tend to see higher PE ratios, and vice versa. A high-growth stock might have a PE ratio above 30, 50, or more. Buying a stock at 50 times its current earnings means you expect significant growth, often driven by new products like revolutionary drugs, cutting-edge watches, TVs, smartphones, or exercise apps. High PE ratio stocks tend to be much more sensitive to changes in earnings compared to low PE stocks, so missing an earnings forecast can dramatically affect the price. Stocks with below-average PE ratios are called value stocks, while those with above-average PE ratios are called growth stocks. Generally, a portfolio with below-average PE ratios is considered less volatile and more conservative than one composed solely of above-average PE ratio stocks.
High-growth stocks with high potential returns also have high volatility. We use forward-looking implied volatilities extracted from the options market rather than historical volatility measures. When no options are available to assess volatility, we default to the industry group’s average volatility. There are over 100 industry subgroups. You may want to lower the risk of a portfolio by screening out stocks with very high volatilities, but keep in mind that this will also dampen your potential upside returns.
For those looking to spot stocks trending above previous ranges, we calculate the 200-day moving average and allow you to choose whether to find stocks breaking out of old trading ranges. This serves as a technical indicator of stock market trends since we don’t necessarily know why a stock has moved beyond prior trading ranges. Perhaps others know something we don’t, and it may be worth conducting further research.
A stock market index refers to an exchange or a group of stocks, such as the Dow Jones 30 or the S&P 500. Exchange-traded funds (ETFs) generally combine a group of stocks based on industry, market capitalization, or other criteria. They function similarly to mutual funds but are typically more passive and have lower management fees. If you like a particular industry but dislike certain stocks within an ETF, you can pick a subset of stocks and sort them by Sharpe Ratio, investing only in the top half. This approach allows you to gain the diversification benefits of an ETF while aiming for higher-than-average returns or lower-than-average risks. Why invest in all 50 energy stocks when 20% are expected to remain flat or decline in price? Why not select the best 20? Simply choose the ETF and then sort by stock Sharpe Ratios. You’ll typically notice some stocks are expected to decline in price.

.webp)
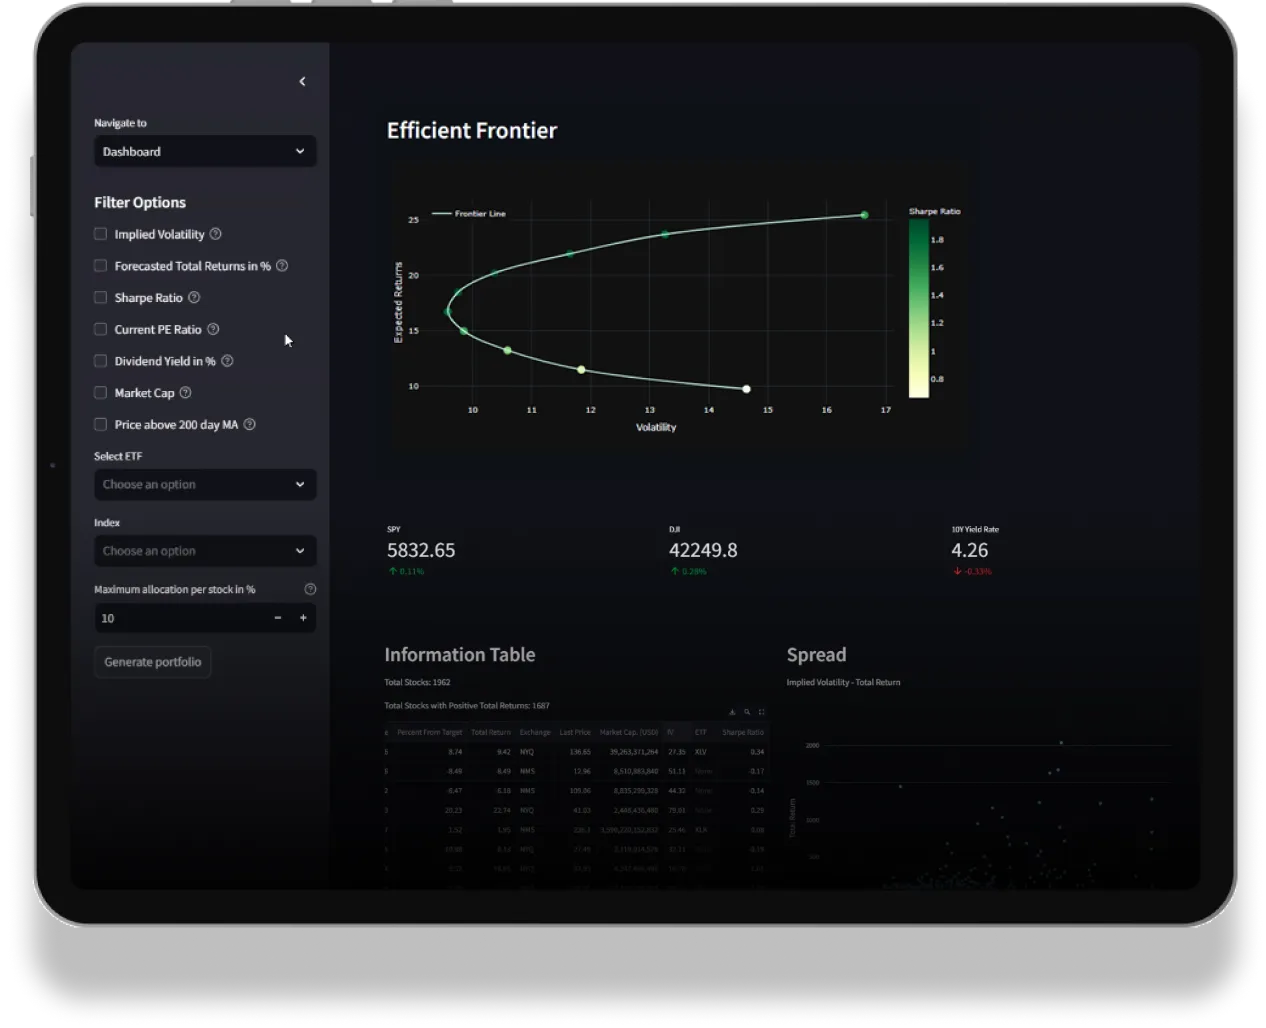
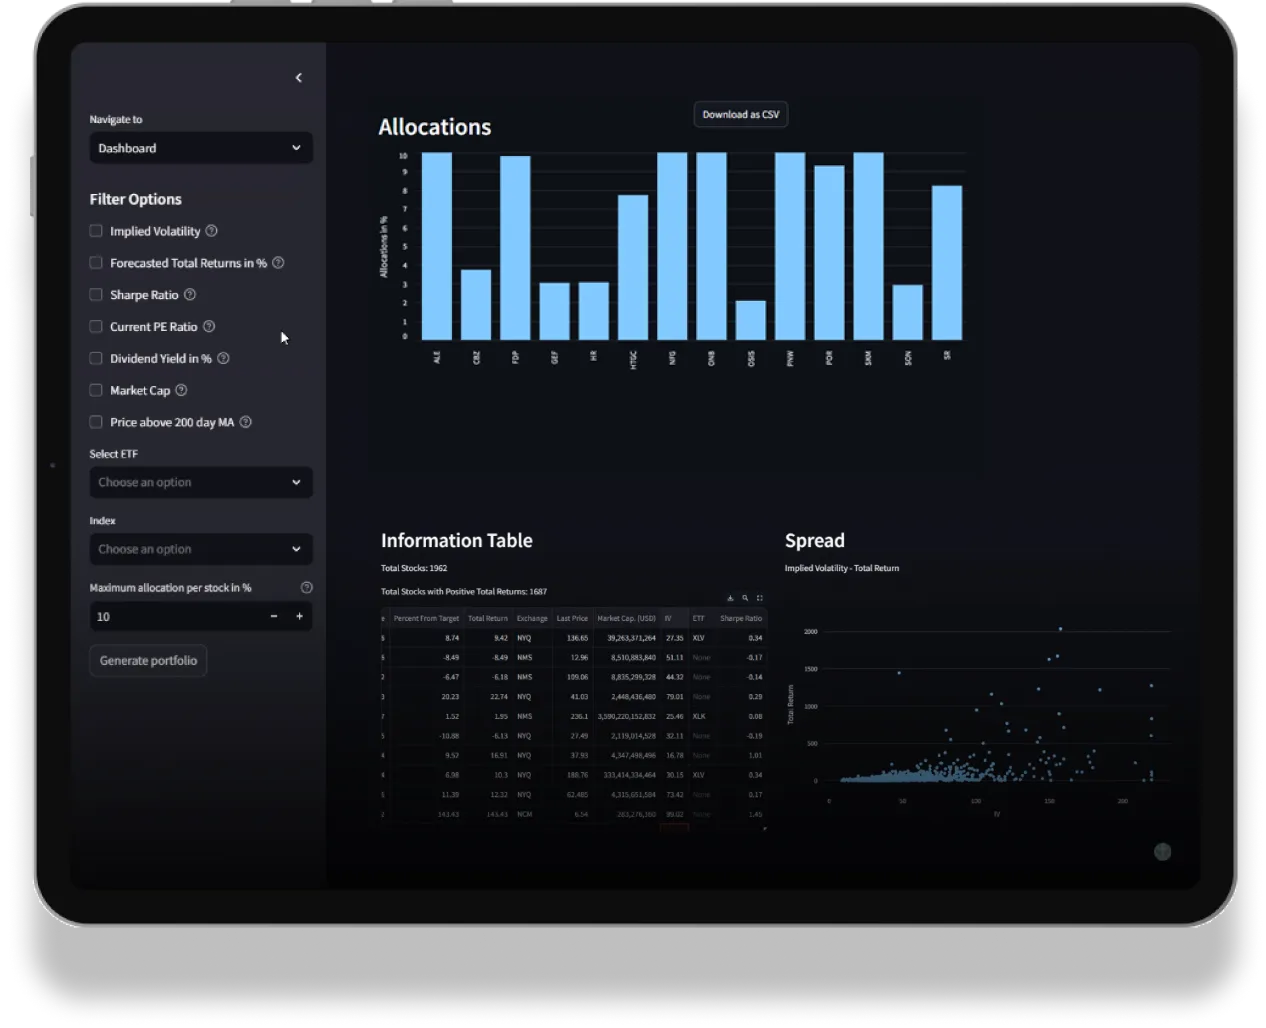
Select Stocks, ETFs or Indexes. Generate portfolios using our enhanced modern portfolio process. Fine tune your portfolio selection.
The ultimate beginner option to get started and gain insight on your investments
Designed for investors who manage their own portfolios and do some of their own research
Designed for the sophisticated investor with multiple portfolios
Designed for money manager who manage multiple client portfolios
The ultimate beginner option to get started and gain insight on your investments
Designed for investors who manage their own portfolios and do some of their own research
Designed for the sophisticated investor with multiple portfolios
Designed for money manager who manage multiple client portfolios
Forward Portfolio is developed by Investing Analytics LLC, founded by Dr. Michael Sklarz, Dr. Norm Miller and Stefan Pampulov. Dr. Sklarz is credited as one of the early founders of the automated valuation model (AVM) used in residential appraisal and is an expert in data and analytics. Through his company, Collateral Analytics, LLC, Dr. Sklarz licensed his AVM, as well as other derivative analytic products, to the financial industry, which included the largest banks in the United States. Collateral Analytcs was sold to Black Knight, Inc. in 2020, which was subsequently acquired by ICE, the Intercontinental Exchange, a financial services company in 2023. Dr. Norm Miller was an esteemed faculty member at the University of San Diego in its real estate program. Dr. Miller was a high-recognized professor and the Ernst Hahn Chair of Real Estate Finance at USD. Prior to joining USD, Dr. Miller was the academic director and the founder and center director of the real estate program at the University of Cincinnati. Stefan Pampulov was a co-founder at Collateral Analytics and managed product development and innovation.
No. Investing Analytics does not manage investments, except for its own accounts. We provide investor tools for money managers and sophisticated investors that manager their own accounts. We provide sample model portfolios based on styles, but do not consider the unique tax circumstances, or specific investor timing desired. Our analysis looks out one year. Short term or day traders will not find our tools very useful. We believe longer term investors and money managers will find our tools useful.
Investing Analytics LLC developed Forward Portfolio initially for its own use to manage its own investment portfolio. Drs. Sklarz and Miller leveraged their decades of analyzing big and disparate data sets to stock investing, including utilizing machine learning models and AI. A research team has now been assembled that is constantly improving the forward-looking valuation models. While other stock screening tools are available that provide similar filters, our tools use forward looking target returns rather than historical returns, forward looking volatility and forward-looking correlations. It is also one of the few if not the only application that combines current stock return data within a portfolio framework that provides the minimum expected risk combination of stocks for any given return target. One can view these tools as modern portfolio theory modernized, including using machine learning tools for analytics.
We include most stocks on the major US exchanges, i.e. Dow Jones, Nasdaq 100 and S&P 500. In total, approximately 4,000 stocks make it into the Forward Portfolio initial filters. From this list we further focus on those with sufficient investor interest to be able to generate implied forward-looking volatilities and target returns one year out.
No. In order to include a stock within our portfolio framework, we need at least two years of history. Therefore new and some microcap stocks will not be part of our universe.
Our intuitive user interface will quickly let a user screen for investments with the highest potential return, based on the user’s acceptable risk level, to generate an optimized portfolio. Filters allow the user to focus on the user’s risk level and the user’s return targets to match the user’s investment objectives, risk tolerance and goals. More explanation is provided in the user guide questions and videos.
Forward Portfolio is best utilized by intermediate to experienced investors, such as money managers and experienced investors. Novice investors could also utilize Forward Portfolio, but will need to understand the basic concepts of investing, such as volatility, price to earnings ratio, etc. and their effects on stock price. Forward Portfolio is also best utilized with a variety of other tools and data sources to ensure that the most appropriate investment decisions are made for each user. Tax considerations are not part of our analysis, but should be considered before an investor sells a stock already owned. For example, a stock with a nice gain in price should not be sold a few days before it becomes qualified as a capital gain versus income, taxed at a higher rate. These considerations should be considerations by money managers that might use the Forward Portfolio.
We allow a 60-day trial for new users that provides access to the first level tier. Money managers will pay about $199 a month down to $19 a month for more limited applications, with annual paid discount of 20%. See current pricing on the website.
Elevate Your Investment Strategy with Advanced Stock Selection

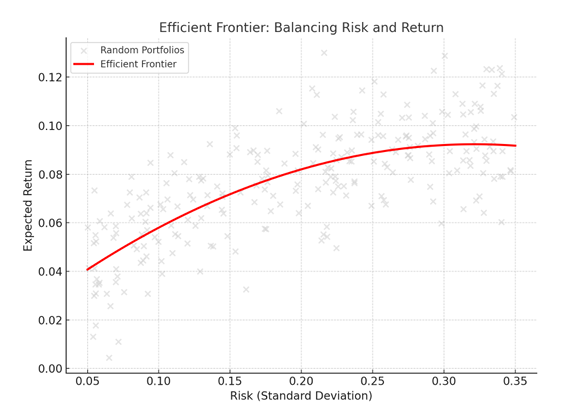
Modern Portfolio Theory (MPT), introduced by Harry Markowitz in 1952, revolutionized investing by showing that success comes not from picking individual stocks but from building diversified portfolios that balance risk and return. By combining assets with different correlations, investors can reduce volatility and achieve better outcomes, a concept illustrated by the efficient frontier, the curve representing the optimal trade-off between risk and reward. Today, MPT underpins strategies used in index funds, ETFs, and robo-advisors, reminding investors that the smartest path is not chasing returns but managing risk wisely through thoughtful diversification.
We empower investors with intuitive, cutting-edge tools to streamline portfolio management and deliver actionable insights, enabling our clients to achieve their financial goals with confidence and efficiency.